How to build a context graph for your organization: a guide for May 2026
When you're figuring out building a context graph, the first thing to know is that you're not starting from scratch. Your team generates context every day through pull requests, Slack decisions, Linear tickets, and documentation that's accurate for about three weeks before it drifts. The problem isn't that you lack knowledge, it's that nothing connects code to the decisions behind it, decisions to the people who made them, or people to the systems they own. A context graph gives all that scattered information the structure it needs to answer questions in seconds instead of Slack threads.
TLDR:
- A context graph maps your organization's knowledge and connects code, decisions, ownership, and dependencies into a queryable structure
- Fortune 500 companies lose $31.5B yearly because documentation becomes outdated the moment it's written
- Connect existing systems (GitHub, Slack, Linear) and let relationships surface automatically instead of building graphs manually
- Start with high-friction workflows like onboarding or incident response where scattered context costs the most time
- Falconer builds and maintains your context graph automatically by connecting your tools and keeping relationships current as code changes
What a context graph actually is (and why it solves the scattered context problem)
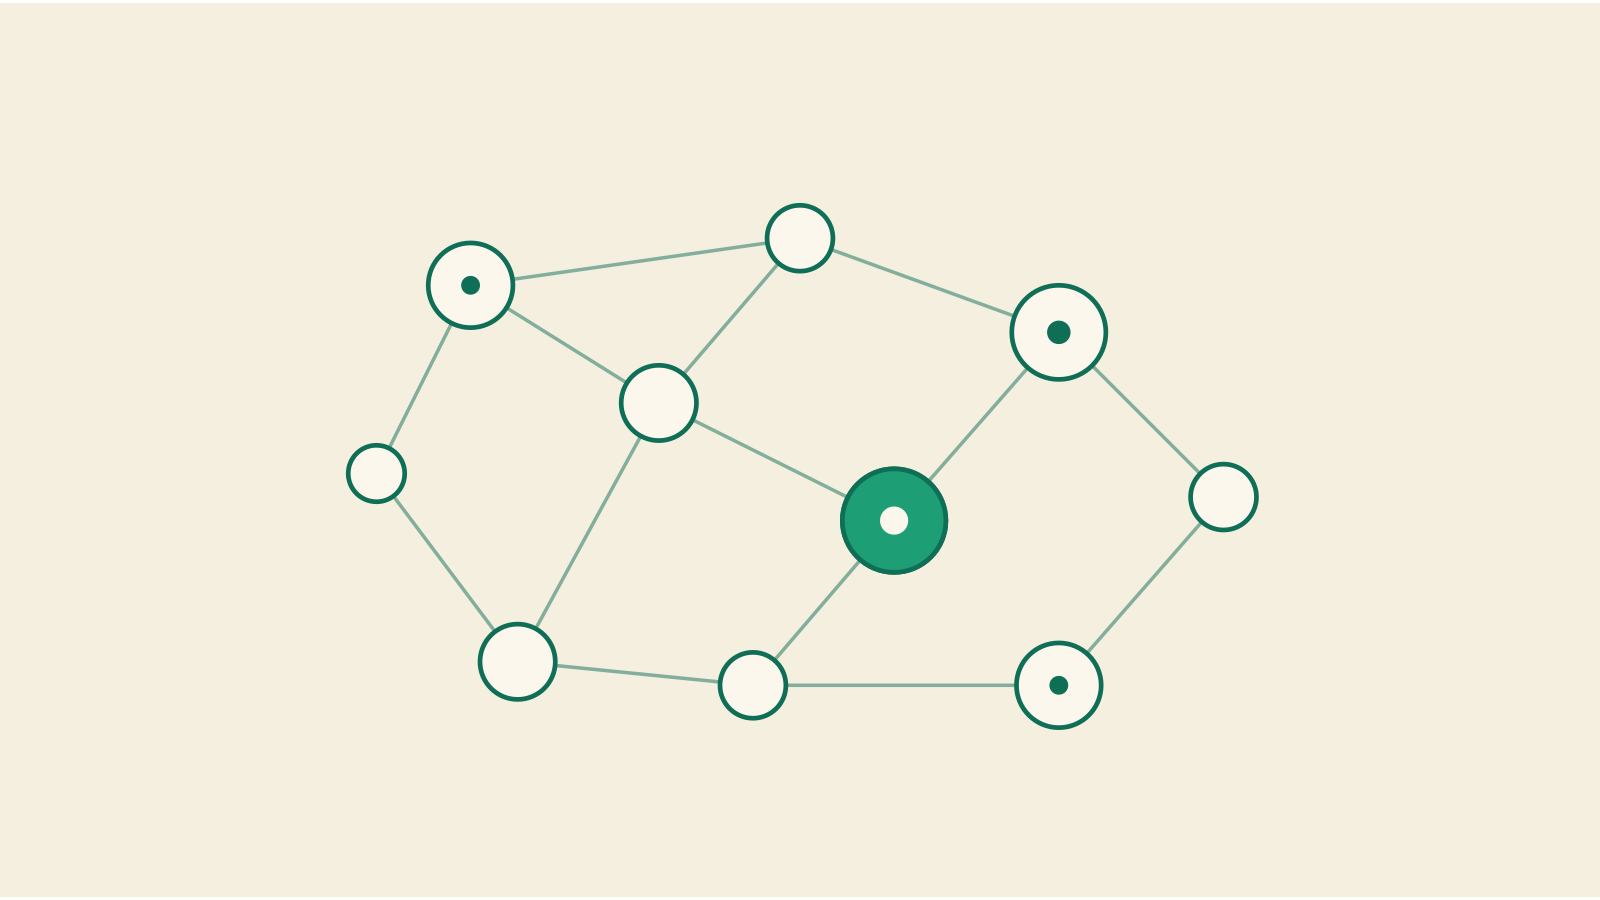
A context graph is a structured map of everything your organization knows and, more importantly, how that knowledge connects. It tracks who owns what, how systems relate to each other, which decisions were made and why, and where the authoritative answer lives for any given question.
Your team's knowledge already exists. It's trapped in pull requests, buried in Slack threads, scattered across Notion pages, and fragmented inside Linear tickets. This distributed knowledge means no single person holds the full picture. A context graph takes all of that dispersed information and gives it shape, linking code to the decisions behind it, decisions to the people who made them, and people to the systems they own.
That structure is what separates a team that constantly re-asks the same questions from one that moves fast with shared understanding.
The entities that make up your context graph
Every context graph is made up of a few core entity types. You already have all of them. They're just not connected yet.
Code entities
Repositories, services, files, functions, and API endpoints. These are the most granular building blocks, and they change constantly, which is exactly why they need to be linked to everything else in your graph.
Documentation
Specs, runbooks, onboarding guides, architecture docs, and RFCs. These describe intent and process, but they only stay useful when they're tied to the code and decisions they reference.
People and ownership
Who built what? Who maintains it now? Who approved that migration? Mapping people to the systems and decisions they own turns your graph into something you can query with confidence.
Tasks and projects
Tickets in Linear, issues in GitHub, project briefs in Google Docs. These carry the "what we're doing and why" context that rarely makes it into long term memory.
Relationships
A function tied to a service, tied to an RFC, tied to the engineer who wrote it, tied to the ticket that requested it. Without those connections, you have a pile of data. With them, you have a graph that can answer questions no single artifact could answer alone.
| Entity Type | What It Captures | Common Examples | Connects To | | --- | --- | --- | --- | | Code Entities | The actual technical implementation that runs your product and changes with every merge | Repositories, microservices, API endpoints, database schemas, configuration files, individual functions | Documentation that describes them, people who wrote or own them, decisions that shaped their architecture | | Documentation | Written explanations of intent, process, and architecture that describe how systems work and why | Architecture decision records, runbooks, onboarding guides, API specifications, migration plans, incident postmortems | Code entities they reference, people who authored them, projects they support, decisions they document | | People and Ownership | Human context about who built systems, who maintains them now, and who has authority over changes | Service owners, repository maintainers, subject matter experts, team leads, on-call rotations | Code they wrote or own, decisions they made or approved, documentation they maintain, projects they lead | | Tasks and Projects | Work in progress and its surrounding context about what your team is building and why | Linear tickets, GitHub issues, project briefs, feature requests, bug reports, technical debt items | Code that implements them, people assigned to them, documentation that guides them, decisions that approved them | | Decisions and Rationale | The reasoning behind technical choices, including constraints, alternatives, and outcomes | Technology selections, architectural patterns, migration strategies, deprecation plans, scaling approaches | People who made them, code that resulted from them, documentation that records them, tasks that triggered them |
Why manual documentation can't keep up (and why you shouldn't try)
Think about how your codebase looked six months ago. Now think about how many docs from that era still reflect reality. The gap between what's written and what's true widens every single day, with every merged PR, every architectural decision made in a Slack thread, every ownership change that nobody updates in the wiki.
According to IDC, Fortune 500 companies lose roughly $ 31.5 billion annually to knowledge management failures. That number shouldn't surprise anyone who's watched a carefully written runbook become fiction within weeks.
The problem isn't that teams don't write documentation. It's that documentation is a snapshot, and your codebase is a moving target.
Static artifacts can't track systems that constantly change. Every attempt to close that gap manually creates more surface area to maintain, more pages to audit, more staleness to accumulate. You end up in a cycle where the effort to keep docs current rivals the effort to write them in the first place. So stop trying to win that race. Build a system that updates itself.
Connect your systems and let relationships surface
The fastest way to build a context graph is to stop thinking of it as something you construct from scratch. Connect the systems where your team already works and let the structure reveal itself.
When you connect GitHub to your documentation tool. When Slack is connected, decisions that would otherwise vanish into scroll-back get anchored to the repos and tickets they reference. Linear tickets link to pull requests, which link to the engineers who wrote them, which link to the services those engineers own. Knowledge graphs make connections explicit by making these connections explicit. None of that requires someone to sit down and draw a diagram.
Your team generates context every day through normal work. The graph doesn't need to be designed top-down by an architect with a whiteboard. It gets assembled from the bottom up, by observing how information actually flows across your tools. Connect the sources, and the relationships are already there waiting.
Core entities to capture (code, decisions, ownership, and dependencies)
Knowing the entity types is one thing. Knowing what to actually track within them is where the value shows up.
- Code ownership: Map every service and repo to a current owner. When someone asks "who owns the billing service?" the graph should answer instantly, not trigger a Slack scavenger hunt.
- Architectural decisions: Capture why your team chose Postgres over DynamoDB, or why the onboarding flow was rebuilt in Q3. Without the rationale, future engineers relitigate the same debates.
- Project dependencies: Which services depend on the auth layer? What breaks if you deprecate that internal API? These relationships prevent surprises during deploys.
- Decision rationale: Link every major call to its context, who approved it, what alternatives were considered, and what constraints shaped the outcome.
Each of these answers a question your team already asks weekly. The difference is whether the answer takes five seconds or forty-five minutes.
How to structure decision tracing in your graph
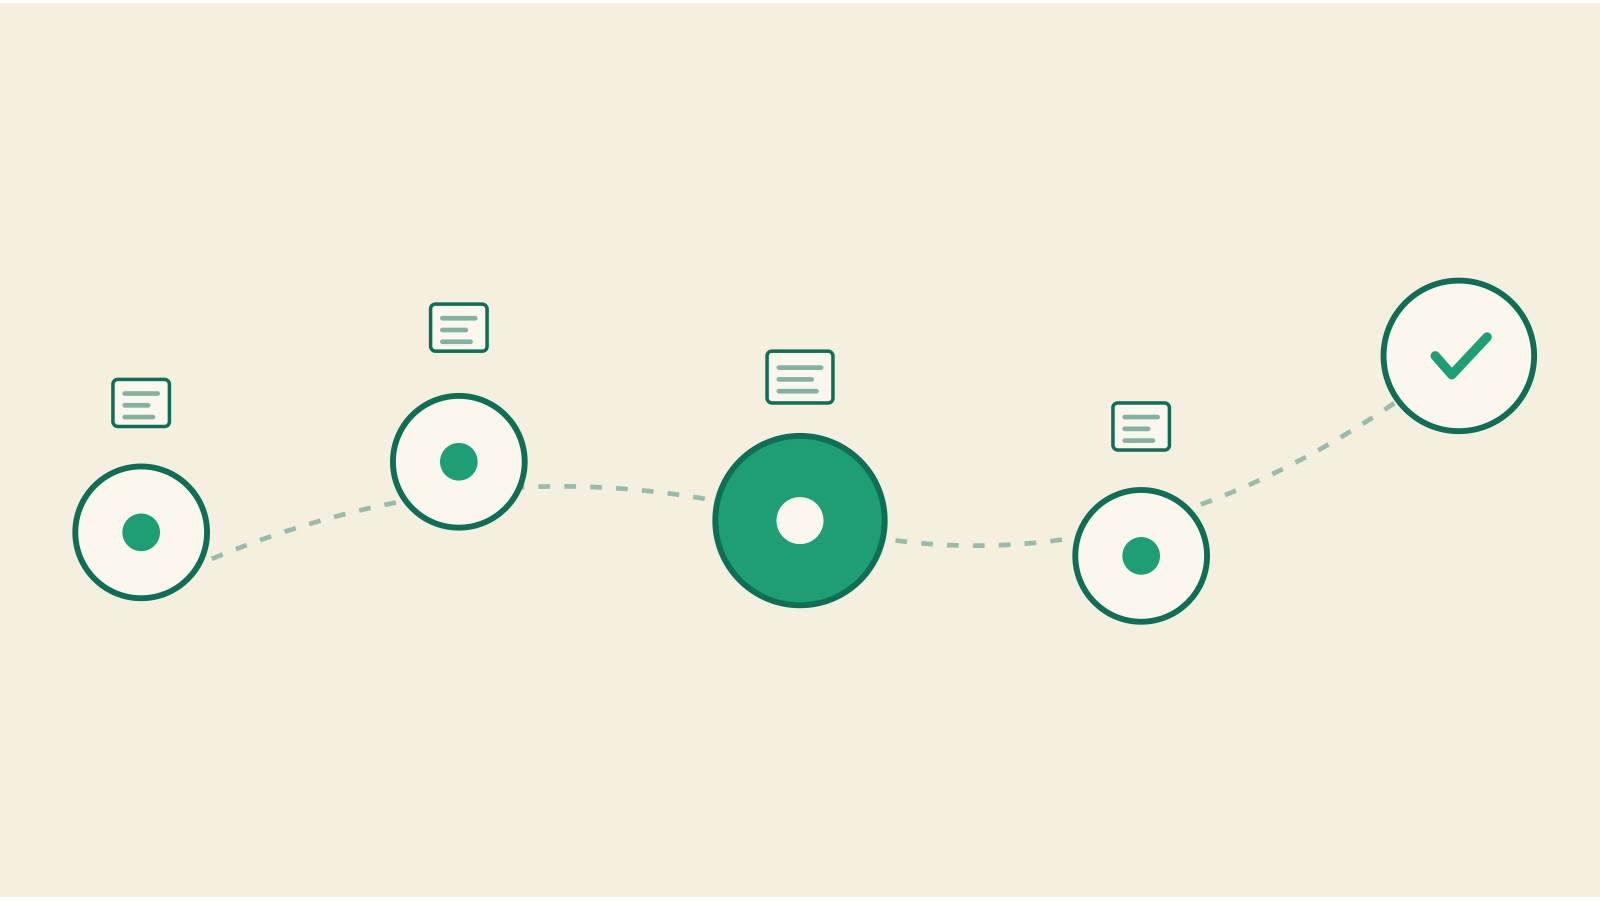
Capturing that a decision was made is table stakes. What matters is recording the sequence: the trigger, the inputs, the constraints, and the outcome, in that order. Decision tracing gives your graph a timeline, not a snapshot.
Structure each decision as a chain of connected nodes:
- Trigger: what prompted the decision? A performance incident, a customer request, a scaling threshold.
- Informing context: what data, benchmarks, or prior decisions shaped the discussion?
- Constraints: budget limits, timeline pressure, staffing gaps, compliance requirements.
- Alternatives considered: what was rejected, and why?
- Outcome and owner: what was chosen, and who's accountable for it?
When a new engineer asks "why do we do it this way?" the trace gives them the full story without interrupting anyone. And when AI agents reason over your graph, they follow the same chain, producing answers grounded in your team's actual logic instead of generic inference.
Making updates automatic instead of another manual task
A context graph that requires manual upkeep is just documentation with extra steps. The whole point is that updates happen as a byproduct of work.
When a pull request merges, the graph should detect which services changed and flag docs for automatic revision. When a Linear ticket moves to "Done," project context updates without anyone opening a wiki. When ownership transfers in GitHub, the graph reflects it immediately.
These triggers turn routine actions into maintenance events:
- Merged PRs update code entity relationships and surface stale documentation
- Task status changes propagate through project dependencies
- New Slack decisions get linked to the repos and specs they affect
The pattern is simple: your team keeps working the way it already works, and the graph stays current in the background. No doc audit sprints, no quarterly cleanup drives. The system watches for change and responds to it, so your engineers never have to choose between shipping code and keeping context alive.
Starting small with high-value workflows
You don't need to model your entire organization on day one. Trying to do so is the fastest way to stall a context graph initiative before it delivers any value. Pick one workflow where scattered context causes the most friction, and start there.
The best candidates share a few traits:
- They involve frequent context switching across multiple tools
- They generate repeated questions that eat into senior engineers' time
- They carry high decision density, where the "why" behind choices matters as much as the "what"
For most teams, that means onboarding or incident response. New hires touch every layer of your stack and expose every gap in your knowledge chain. Incident response demands fast answers across services, ownership boundaries, and historical decisions. Both workflows punish missing context immediately and visibly.
Get the graph working for one of those areas first. Once your team sees answers surfacing in seconds instead of Slack threads, expanding to adjacent workflows becomes an easy sell. Iterate outward from proven value instead of trying to boil the ocean on a whiteboard.
How Falconer builds your context graph automatically
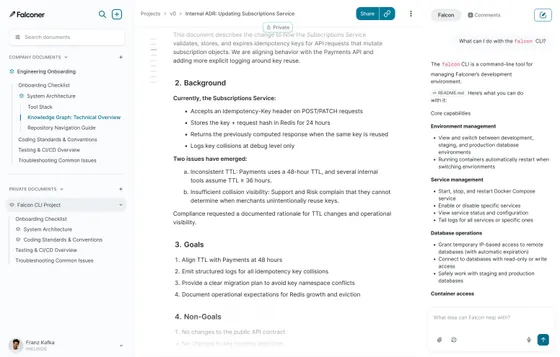
Everything we've walked through so far, connecting systems, capturing entities, tracing decisions, and automating updates, is what Falconer does the moment you plug in your stack. Connect your development tools, and we construct the knowledge graph for you, mapping code to owners, decisions to rationale, and services to their dependencies.
Ask "who owns the billing service?" and Falconer reasons across your connected systems to give you a cited answer in seconds, without manual configuration on your end.
You keep shipping code and making decisions. The graph keeps itself current in the background. That's what building a context graph looks like when the heavy lifting is handled for you.
Final thoughts on connecting your team's scattered context
You need a context graph that builds itself from the work your team already does. Connect your tools, let the relationships surface, and stop losing hours to questions that should take seconds. Give Falconer a try and see how fast answers appear when your context is connected.
FAQ
Can I build a context graph for my organization without hiring a dedicated knowledge management team?
Yes. The most effective context graphs build themselves by connecting your existing tools like GitHub, Slack, and Linear, then extracting relationships automatically as your team works. Manual curation doesn't scale and creates the same maintenance burden you're trying to escape.
What's the difference between a context graph and a knowledge base?
A knowledge base stores static documents, while a context graph maps the relationships between code, decisions, people, and systems, then keeps those connections current as things change. Knowledge bases decay immediately after writing; context graphs update themselves as your team ships code and makes decisions.
How do I structure decision tracing in a context graph?
Capture the full chain: what triggered the decision, what context informed it, what constraints existed, which alternatives were considered, and who owns the outcome. This gives future engineers and AI agents the reasoning behind choices, beyond the final call alone.
Should I map my entire organization's knowledge before launching a context graph?
No. Start with one high-friction workflow like onboarding or incident response where scattered context causes visible pain. Once the graph proves value there, expanding to adjacent workflows becomes straightforward without a massive upfront commitment.
How long does it take for a context graph to start surfacing useful answers?
With automated tools like Falconer, you get a working graph the moment you connect your systems, with cited answers appearing within seconds of setup. Manual approaches take weeks to months and require constant maintenance to stay accurate.
Ready to get started?
Create an account and start building your knowledge base — no contracts or credit card required. Or, contact us to design a custom package for your team.
Ready to get started?
Create an account and start building your knowledge base — no contracts or credit card required. Or, contact us to design a custom package for your team.